Transparent Patient Adherence
Automated Peritoneal Dialysis (APD) Cyclers embedded with Remote Patient Management (RPM) technology can help detect treatment-related issues, allowing intervention to potentially prevent early clinically significant events.
Background
Historically, clinicians have been unable to proactively identify patients missing or shortening their Peritoneal Dialysis treatments.
Objectives
Method
Data on 399 European APD patients were analyzed
- Patients that were utilizing an APD device with Sharesource Connectivity Platform for 3 months or more were examined for weekly treatment frequency and actual versus prescribed treatment time.
- An assumption was made that patients perform APD therapy 7 days per week.
- Patients with gaps in treatment > 30 days were omitted/excluded.
- Time on treatment was determined from the first treatment after the training period to the last available treatment for a patient.
- Weekly treatment frequency was the number of treatments in Sharesource Connectivity Platform / 30 * 7. E.g. If a patient had 27 treatments out of 30 days, then weekly rate = (27/30) * 7 = 6.3
- Treatment differences were treatment time prescribed - actual treatment time performed.
Note: Claria with Sharesource was used in this study which is similar in function, design and indication to Amia with Sharesource
What have we seen so far?
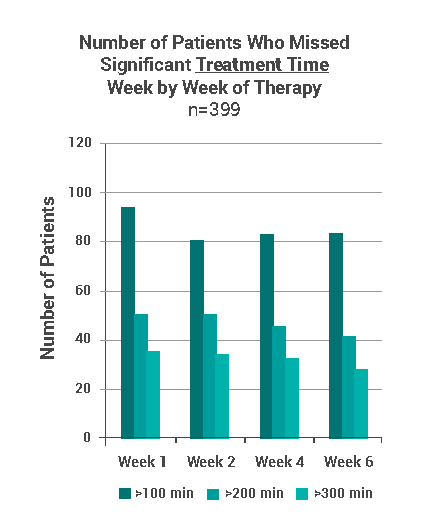
In the 1st week of therapy
24.3% (97) and 9.5% (38) of patients had >100 minutes and >300 minutes, respectively, less actual therapy time than prescribed.
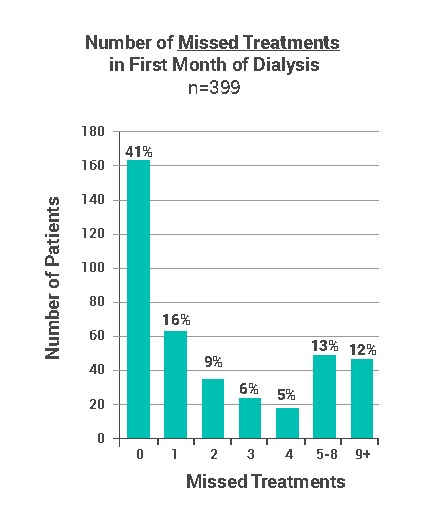
During the 1st month of therapy
30% (115) of patients missed >4 treatments (>10% of prescribed therapy) and 12% (47) of patients missed >9 treatments.
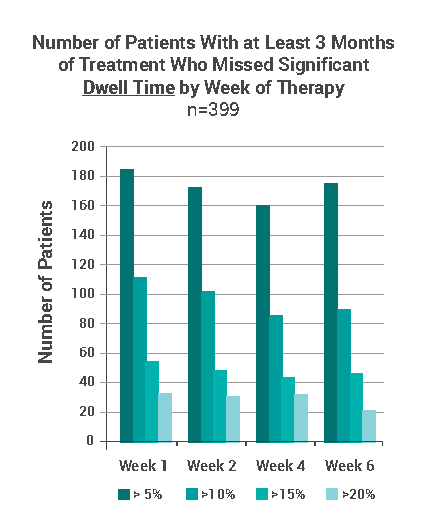
In combined results of weeks 1, 2, 4 and 6*
- 43% of patients missed >5% of prescribed dwell time
- 20.6% of patients missed >10% of prescribed dwell time
- 11.9% of patients missed >15% of prescribed dwell time
- 7% of patients missed >20% of prescribed dwell time
* Weeks 3 and 5 showed similar results to the weeks presented here. They were not included in the graphs and combined results for simplicity.